

Forecast in Excel
- obayedmoni
- Jun 12, 2021
- 2 min read

What does Forecasting mean?
Forecasting is a technique that uses historical data as inputs to make informed estimates that are predictive in determining the direction of future trends. Businesses utilize forecasting to determine how to allocate their budgets or plan for anticipated expenses for an upcoming period of time.
Forecast function in Excel
The FORECAST function in Excel predicts a future value along a linear trend. The FORECAST.ETS function in Excel predicts a future value using Exponential Triple Smoothing, which takes into account seasonality.
FORECAST.LINEAR function which produces the exact same result.
FORECAST.LINEAR
Process:
1. The FORECAST.LINEAR function below predicts a future value along a linear trend.

Explanation: when you drag the FORECAST.LINEAR function down, the absolute references ($B$2:$B$11 and $A$2:$A$11) stay the same, while the relative reference (A12) changes to A13 and A14.
Display Forecast Chart
1. Enter the value 89 into cell C11, select the range A1:C14 and insert a scatter plot with straight lines and markers.

Note: you can add a trend line to an Excel chart, Excel can display the equation in a chart. This equation predicts the same future values.
FORECAST.ETS
The FORECAST.ETS function in Excel 2016 or later is a great function which can detect a seasonal pattern.
Process:
1. The FORECAST.ETS function below predicts a future value using Exponential Triple Smoothing.

Remember: the last 3 arguments are optional. The fourth argument indicates the length of the seasonal pattern. The default value of 1 indicates seasonality is detected automatically.
Display Forecast Chart
2. Enter the value 49 into cell C13, select the range A1:C17 and insert a scatter plot with straight lines and markers.

3. You can use the FORECAST.ETS.SEASONALITY function to find the length of the seasonal pattern. After seeing the chart, you probably already know the answer.

Conclusion: in this example, when using the FORECAST.ETS function, you can also use the value 4 for the fourth argument.
Creating Forecast Sheet Automatically
In Excel 2016 or later version you can use the Forecast Sheet tool to create a visual forecast worksheet automatically.
Process:
1. Select the range A1:B13 shown above.
2. On the Data tab, in the Forecast group, click Forecast Sheet.

Excel launches the dialog box.
3. Specify when the forecast ends, set a confidence interval (95% by default), detect seasonality automatically or manually set the length of the seasonal pattern, etc.

4. Click Create.
This tool uses the FORECAST.ETS function and calculates the same future values. The lower and upper confidence bounds are a nice bonus.
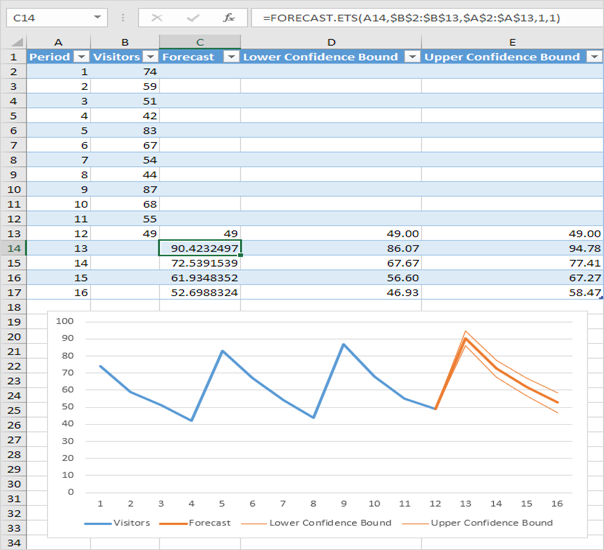
Explanation: in period 13, we can be 95% confident that the number of visitors will be between 86 and 94.


Comments